How to debug NodeJS on VS Code
Learn how to efficiently debug Node.js applications using Visual Studio Code, the popular integrated development environment (IDE).
What is a debugger?
Debugging is the process of identifying and resolving errors or defects within a computer program or system. It involves analyzing code, tracing execution, and testing to pinpoint and fix issues that cause undesirable behavior or crashes.
Many javascript developers use console.log to investigate some unexpected behaviour on the code that they are writting. This is a simple and efficient way to idetify issues in small projects, but you start to work on medium/big projects it become a bit messy and hard to debug you codebase.
Getting Started
Let's use as example this small nodejs program that just add two numbers.
const { sum } = require("./math");

const number1 = 1
const number2 = 2

const result = sum(number1, number2)

console.log("The result is:", result)
const sum = (number1, number2) => {
const result = number1 + number2;
return result;
};
module.exports = { sum };
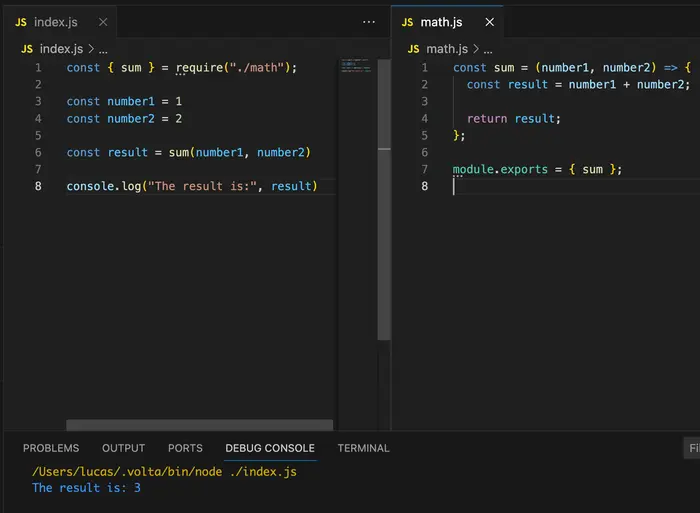
After run this program we get the result of sum function as expected sum of number1 and number2:

What is common to do if something went wrong with the sum function is to start writting console.log statements to try to debug the statement that is not working properly.
Now, let's add a bug on our sum function and simulate the debug process with console.log
const sum = (number1, number2) => {
  console.log("number1:", number1);
  console.log("number2:", number2);

  const result = number1 * number2;
  console.log("result:", result);

  return result;
};

module.exports = { sum };
The result
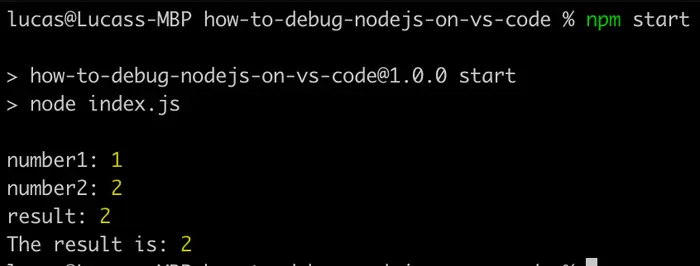
We can see that the result is not correct and the function is not returning the value of number1 plus number2 and in this specific case is not so hard to identify what is wrong with your code, but in more complex scenario it can be a bit trick.
So let's get rid of console.log and use the native debug tool of VS Code to identify and fix the introduced bug.
const sum = (number1, number2) => {
  const result = number1 * number2;

  return result;
};

module.exports = { sum };
Setup
For the debug setup you should go to the Activity Bar and click on the Run and Debug option. On Run and Debug view, click on the link create a launch.json file and select the Node.js debugger option.
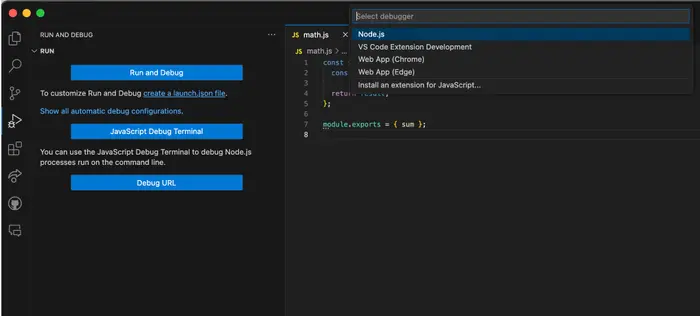
After this steps it will create launch.json file under .vscode folder
{
    // Use IntelliSense to learn about possible attributes.
    // Hover to view descriptions of existing attributes.
    // For more information, visit: https://go.microsoft.com/fwlink/?linkid=830387
    "version": "0.2.0",
    "configurations": [
        {
            "type": "node",
            "request": "launch",
            "name": "Launch Program",
            "skipFiles": [
                "<node_internals>/**"
            ],
            "program": "${workspaceFolder}/index.js"
        }
    ]
}
Note
Normally it will referenciate the root javascript file, but make sure if the file name used is the one expected.
Debug
Now it is time to execute our program in debug mode. Go to Run and Debug view, on top dropdown select the debug configuration created on launch.json file.
Make sure that you added a breakpoint on the code like I'm doing on line 6 of index.js file.
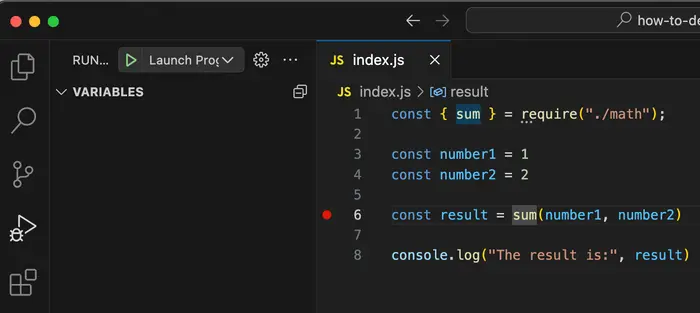
Now it is time to click on the green start icon and wait it stop on the first breakpoint. If you set a breakpoint on the executed code, you will see this important box.

Continue / Pause F5
- Continue: Resume normal program/script execution (up to the next breakpoint).
- Pause: Inspect code executing at the current line and debug line-by-line.
Step Over F10
Execute the next method as a single command without inspecting or following its component steps.
Step Into F11
Enter the next method to follow its execution line-by-line.
Step Out ⇧F11
When inside a method or subroutine, return to the earlier execution context by completing remaining lines of the current method as though it were a single command.
Restart ⇧⌘F5
Terminate the current program execution and start debugging again using the current run configuration.
Stop ⇧F5
Terminate the current program execution.
Demo
On the gif below we can see the debug process going into code execution flow and find the proposital issue introduced by us in the beginning of this article. The Gif show us easily on sum function that is multiplying instead of add the numbers.
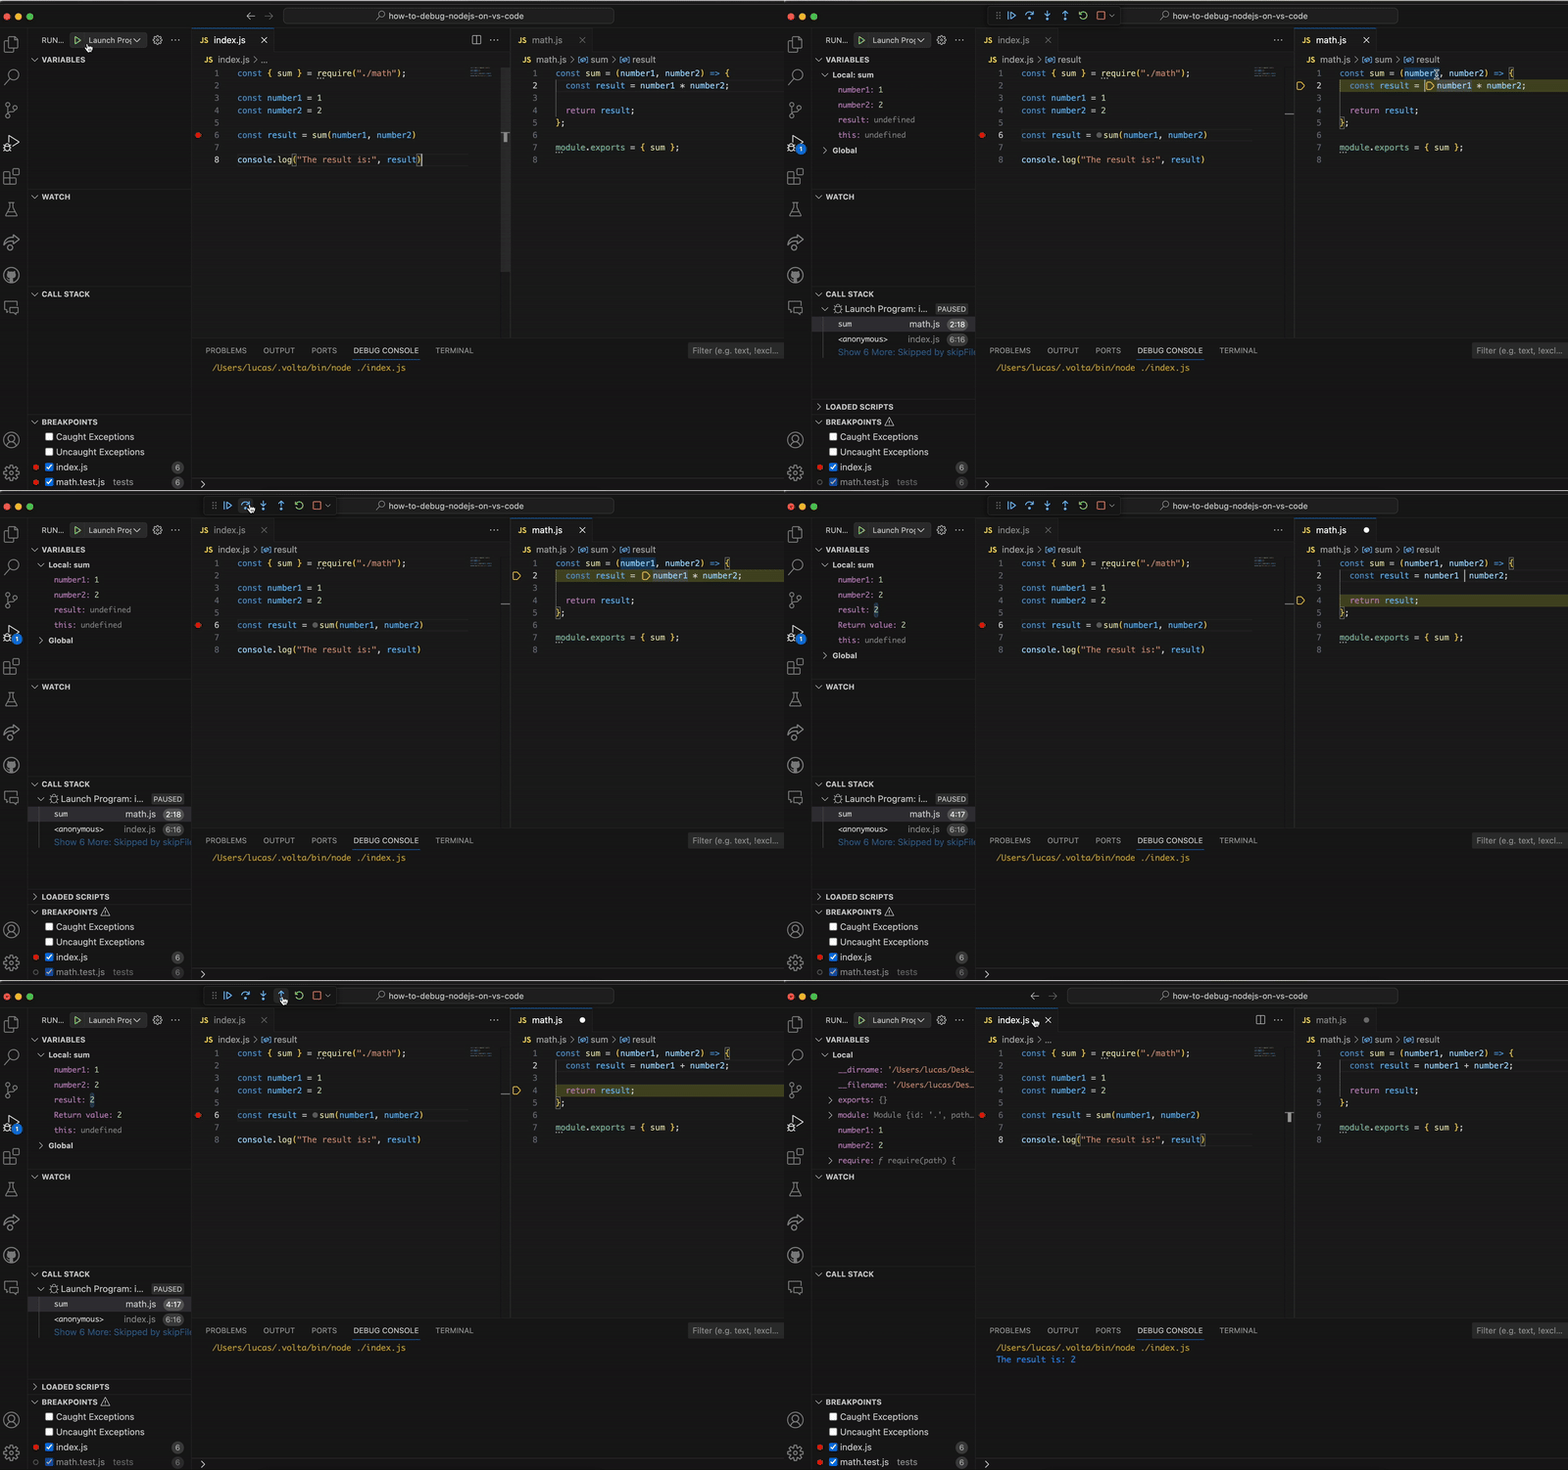
The final code after debug and fix, will be this one
